When retirement income depends on predictable quarterly payments, dividend consistency matters more than clever stock selection. The First Trust Large Cap Core AlphaDEX Fund (NASDAQ:FEX) promises enhanced returns through proprietary factor screening, but its dividend volatility and higher costs raise questions about whether retirees should load up or give up on this approach.
The AlphaDEX Promise: Factor Selection Without Active Management Fees
FEX uses First Trust’s AlphaDEX methodology to select approximately 200 stocks from the S&P 500 based on growth and value factors. Unlike market-cap weighted indexes concentrating holdings in mega-cap tech stocks, FEX spreads exposure evenly. No single holding exceeds 0.75% of the portfolio, with top positions including Micron Technology (NASDAQ:MU | MU Price Prediction), Rocket Lab USA (NASDAQ:RKLB), and Illumina (NASDAQ:ILMN). This creates sector balance: Industrials at 16.1%, Financials at 16%, and Information Technology at 14.5%, compared to the S&P 500’s 34% tech concentration.
The fund’s 88% annual turnover reflects aggressive quarterly rebalancing as stocks move in and out of favor based on factor scores, contrasting sharply with traditional index funds that trade only when index constituents change.
Performance Reality: Paying More for Less
FEX delivered 12.3% annualized returns over the past decade, trailing the S&P 500’s 12.8% despite its 0.57% expense ratio being six times higher than SPDR S&P 500 ETF Trust (NYSEARCA:SPY)’s 0.09%. Over 10 years, this translates to underperformance of roughly 17 percentage points after accounting for additional costs. While FEX outpaced the market in early 2026 by 1.5 percentage points year-to-date, it lagged by nearly 8 percentage points over the trailing five years.
For retirees, the math is straightforward: on a $100,000 investment, FEX costs $570 annually versus $90 for a basic S&P 500 fund, a $480 difference that compounds over time without delivering superior returns.
The Income Volatility Problem
FEX’s dividend pattern creates budgeting challenges for retirees relying on steady income. The fund paid $0.41 per share in Q4 2025, a 26.4% increase from the prior quarter, but this followed a Q2 payment of just $0.27. Such swings make it difficult to plan fixed expenses. The current 1.11% yield barely exceeds the S&P 500’s 1.03%, offering minimal compensation for added unpredictability.
Annual dividends ranged from $0.74 in 2021 to $1.30 in 2025, with no clear growth trajectory, contrasting with dividend-focused strategies designed for retirement income that prioritize payment stability.
Who Should Skip FEX
Retirees needing predictable quarterly income for living expenses should avoid FEX. The dividend volatility makes it unsuitable for budgeting fixed costs like housing or healthcare. Tax-conscious investors in high brackets should also steer clear, as the 88% turnover creates tax inefficiency in taxable accounts, generating short-term capital gains taxed at ordinary income rates. The fund’s $1.4 billion in assets also pales compared to mega-funds like SPY’s $700 billion, potentially creating liquidity concerns during market stress.
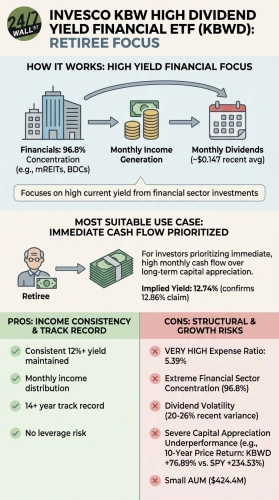
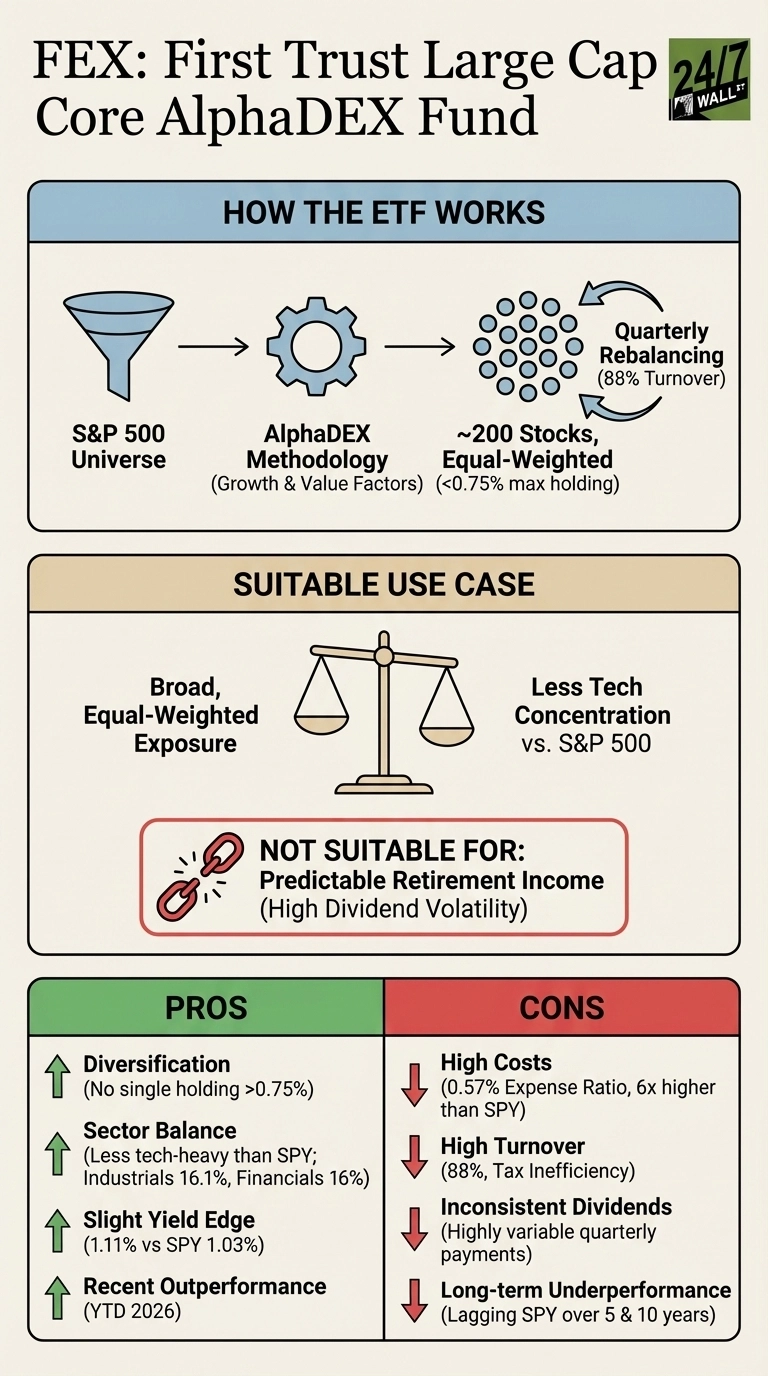 0.75%),” “Sector Balance (Less tech-heavy than SPY; Industrials 16.1%, Financials 16%),” “Slight Yield Edge (1.11% vs SPY 1.03%),” and “Recent Outperformance (YTD 2026).” Cons include “High Costs (0.57% Expense Ratio, 6x higher than SPY),” “High Turnover (88%, Tax Inefficiency),” “Inconsistent Dividends (Highly variable quarterly payments),” and “Long-term Underperformance (Lagging SPY over 5 & 10 years).”” class=”wp-image-1550733″/>
Consider SCHX Instead
The Schwab US Large-Cap ETF (NASDAQ:SCHX) offers a compelling alternative. With a 0.03% expense ratio and just 3% annual turnover, SCHX costs 95% less than FEX while tracking 750 large-cap stocks. The fund’s $63 billion in assets provides deep liquidity, and its minimal trading activity makes it far more tax-efficient for taxable accounts. While SCHX also concentrates in mega-cap tech stocks, its cost advantage and lower complexity make it better suited for buy-and-hold retirement portfolios.
FEX serves as a reminder that sophisticated stock selection strategies often underperform simpler approaches after accounting for costs, making it a questionable choice for retirees who prioritize income stability and tax efficiency.