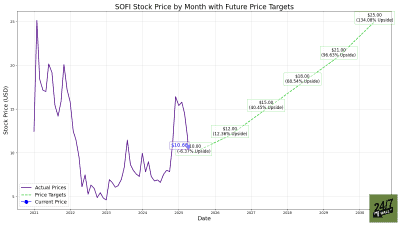
SoFi Technologies (NASDAQ:SOFI | SOFI Price Prediction) climbed from a 52-week low of $8.60 to a high of $32.73 before a sharp reversal brought shares back to $15.39 as of writing. That retreat has reset valuations to a level our model finds compelling. The 24/7 Wall St. price target for SoFi is $17.98, implying 16.88% upside over the next 12 months. Our model carries a 90% confidence level in the $17.98 target.
| Metric | Value |
|---|---|
| Current Price | $15.39 |
| 24/7 Wall St. Price Target | $17.98 |
| Upside | +16.88% |
| Recommendation | BUY |
| Confidence Level | 90% |
A Volatile Year That Punished Shareholders
SOFI entered 2026 at $26.18 and climbed to its 52-week high of $32.73 before a sustained selloff took hold. The stock is now down 21.05% over the past month and 41.83% year-to-date, trading below both its 50-day moving average of $21.25 and 200-day moving average of $23.74.
That selling pressure stands in contrast to strong Q4 2025 results, where SoFi crossed $1 billion in quarterly revenue for the first time. For full year 2025, SoFi reported adjusted EPS of $0.39, beating the $0.363 consensus estimate on revenue of $3.61 billion, up 38.32% year-over-year. Q4 alone delivered EPS of $0.13 against a consensus of $0.11, an 18.18% beat. The gap between business performance and stock performance is the central tension driving our analysis.

The Case for $24 and Beyond
The bull thesis centers on SoFi’s financial services segment, which grew revenue 78% year-over-year in Q4 with contribution profit doubling to $230.8 million. Fee-based revenue reached a record $443 million, up 53% YoY, reducing dependence on interest rate spreads.
Management guided for adjusted EPS of approximately $0.60 in 2026 and a medium-term EPS CAGR of 38% to 42% through 2028. Bullish analysts carry a consensus target of $25.32, with 3 strong buy and 5 buy ratings among the 22 analysts covering the stock. Our bull scenario reaches $24.53 by March 2027, driven by the loan platform business annualizing at $15 billion in originations, member growth of at least 30% year-over-year, and expanding crypto and stablecoin offerings.
The Risks Worth Watching
Credit quality is the primary bear case lever. The personal loan annualized charge-off rate rose to 2.80% in Q4, up from 2.60% sequentially, net interest margin contracted 19 basis points YoY to 5.72%, and technology platform accounts declined 23% YoY due to a large client transitioning off.
At a trailing P/E of 39x, the valuation demands strong execution. Our bear scenario prices SOFI at $14.07 if credit deterioration accelerates or origination volumes compress.
Bears also point to 2 sell and 2 strong sell ratings among covering analysts, though the Q4 net income decline is largely a base-effect issue from a one-time prior-year tax benefit, and management’s adjusted EBITDA guidance of approximately $1.6 billion for 2026 at a 34% margin reflects an operationally profitable, scaling business.
The $17.98 Target at $15.39, With Credit Quality as the Swing Factor
The 24/7 Wall St. price target of $17.98 carries a 90% confidence in the $17.98 price target. The selloff has created a more reasonable entry point against a business growing revenue at roughly 38% annually and guiding for continued acceleration.
The case strengthens if personal loan charge-off rates stabilize and the financial services segment sustains its 70%+ growth pace. The case weakens if macro conditions pressure originations or credit losses widen beyond 2.80% annualized rate.
Here is where the 24/7 Wall St. price target model projects SoFi could trade in the coming years, assuming management delivers on its 2025 to 2028 targets of at least 30% revenue growth and 38% to 42% EPS growth annually.
| Year | 24/7 Wall St. Price Target |
|---|---|
| 2026 | $17.98 |
| 2027 | $21.50 |
| 2028 | $25.50 |
| 2029 | $30.00 |
| 2030 | $25.26 (base) to $45.03 (bull) |
These projections assume SoFi sustains its member growth trajectory and continues monetizing its financial services ecosystem. Significant upside or downside could result from shifts in the interest rate environment, consumer credit quality, or the pace at which the loan platform business scales toward its $15 billion annualized origination target.