Geopolitical tensions and governance concerns in China have prompted institutional investors to reallocate emerging-market exposure toward India, Brazil, Southeast Asia, and Mexico. The standard MSCI Emerging Markets benchmark still allocates a meaningful portion of its weight to Chinese equities, leaving passive EM allocations exposed to a country that many investors no longer want concentrated in the portfolio. Three funds offer different ways to maintain exposure to emerging markets while sidestepping that concentration: the iShares MSCI Emerging Markets ex China ETF (NASDAQ:EMXC | EMXC Price Prediction), the Columbia EM Core ex-China ETF (NYSEARCA:XCEM), and the SPDR MSCI Emerging Markets StrategicFactors ETF (NYSEARCA:QEMM).
Each fund approaches the same problem from a different angle. EMXC and XCEM explicitly exclude China from their indices. QEMM keeps the full emerging markets universe but uses factor screens that have historically produced a lower China weight than a vanilla EM benchmark. The right choice depends on whether an investor wants a clean exclusion, a cheaper version of the same idea, or a factor-driven portfolio that happens to lean away from China without making it the central thesis.
Why investors are rotating the EM book
The case for reducing China’s weight in an EM allocation rests on a mix of regulatory unpredictability, tensions over Taiwan, and questions about whether Chinese growth will translate into shareholder returns. Money flowing out of that exposure has largely landed in India, Taiwan, South Korea, Brazil, and parts of Southeast Asia. Those countries dominate the indexes the funds below track, which is why the ex-China trade has effectively become a bet on Asia ex-China plus Latin America.a
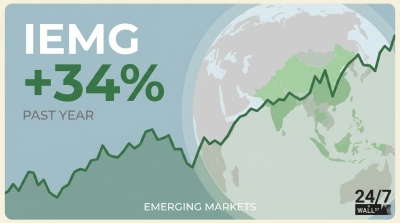
The numbers in 2026 reflect that rotation. EMXC is up 29% year to date and 58% over the past year, with shares around $94. XCEM has tracked closely, up 27% YTD and 54% over one year. QEMM, the factor fund that retains some China exposure, is up 19% YTD and 30% over the past year, a meaningful gap that illustrates how much of the EM rally has come from countries other than China.
EMXC: the default ex-China vehicle
EMXC is the largest and most liquid emerging markets ex-China ETF, with assets reported around $22 billion and an expense ratio of 0.25%. It tracks the MSCI Emerging Markets ex China Index, the same parent index used by most institutional EM benchmarks, with the China component stripped out. For investors whose existing core EM holding is an iShares or MSCI-tracking fund, EMXC slots in cleanly without changing the rest of the methodology.
The portfolio is dominated by Taiwan at roughly 30% of assets, South Korea around 21%, and India near 17%, with Brazil and South Africa rounding out the largest positions. That mix means EMXC is heavily a North Asia technology fund, with Taiwan Semiconductor and Samsung Electronics carrying the index. An investor buying EMXC is implicitly buying both the AI hardware supply chain and the broader EM growth story.
The main thing to keep in mind is concentration at the top. Taiwan and South Korea together make up roughly half the fund, so a Taiwan‑specific shock, whether from a chip‑cycle downturn or cross‑strait tensions, would hit EMXC harder than a more broadly diversified EM product.
XCEM: the same idea at a lower cost
XCEM was an early entrant in the ex-China category and tracks the Beta Advantage Emerging Markets ex-China Core Index. It carries an expense ratio of 0.16%, lower than EMXC, with assets near $1.8 billion. For investors who view the ex-China decision as a long-term structural call rather than a tactical trade, the cost differential compounds over time.
Country and sector exposures are similar to EMXC, with Taiwan, South Korea, and India anchoring the portfolio. Performance has tracked closely as well, with shares around $49 and a one-month gain of 19%. The differences between XCEM and EMXC come down to index methodology details and trading liquidity.
Liquidity is the main practical difference. EMXC trades far more volume than XCEM, which matters for active traders and institutions moving size more than it does for long‑term allocators. For investors with a buy‑and‑hold mindset, the lower fee on XCEM becomes an increasingly hard advantage to ignore.
QEMM: the contrarian factor pick
QEMM is the overlooked option on this list and the only one that does not explicitly exclude China. It tracks the MSCI Emerging Markets Factor Mix A-Series Index, which equally weights the value, quality, and minimum-volatility sub-indices. The fund holds more than 850 securities, with Taiwan Semiconductor as the top position at roughly 7%, and carries an expense ratio of 0.30%.
The reason QEMM belongs on a list about reducing China exposure is mechanical, not mandated. Quality and low-volatility screens have historically excluded much of the Chinese market due to inconsistent earnings and elevated share-price volatility, resulting in a China weight below the standard EM benchmark. Investors get a residual China allocation in exchange for a portfolio that tilts toward profitable companies trading at lower multiples and exhibiting steadier price behavior.
That tilt also explains the performance gap. QEMM is up 19% YTD versus 29% for EMXC, because factor portfolios have lagged the high-beta Taiwan and Korea exposure that has driven returns in the pure ex-China funds. Over five years, QEMM is up 43%, compared with 76% for EMXC, which captures the cost of the more defensive posture during a strong EM rally.
The key distinction is exposure. QEMM maintains a residual allocation to Chinese equities, which won’t suit investors seeking a clean, zero‑China portfolio. EMXC and XCEM fill that role more directly. For investors who prefer a smoother return profile and are comfortable with a smaller, factor‑driven China weight, QEMM can fit more naturally into a long‑horizon allocation.
How the three funds compare for different investors
For an investor swapping out a core EM index fund and seeking the cleanest possible China exclusion, EMXC offers the deepest liquidity and the closest mirror of the standard MSCI EM methodology. For a long-term holder focused on minimizing fees, XCEM provides essentially the same exposure at a lower expense ratio, with the cost of thinner trading volume. For an investor whose underlying concern is volatility and concentration rather than China specifically, QEMM offers a multi-factor portfolio that has historically held less weight in China without making that exclusion the design goal.
The first two funds are close substitutes, and the choice between them is largely a matter of cost versus liquidity. QEMM is a different product that addresses a related but distinct question, which is why it earns a place on a list that would otherwise read as two near-identical funds and a footnote.